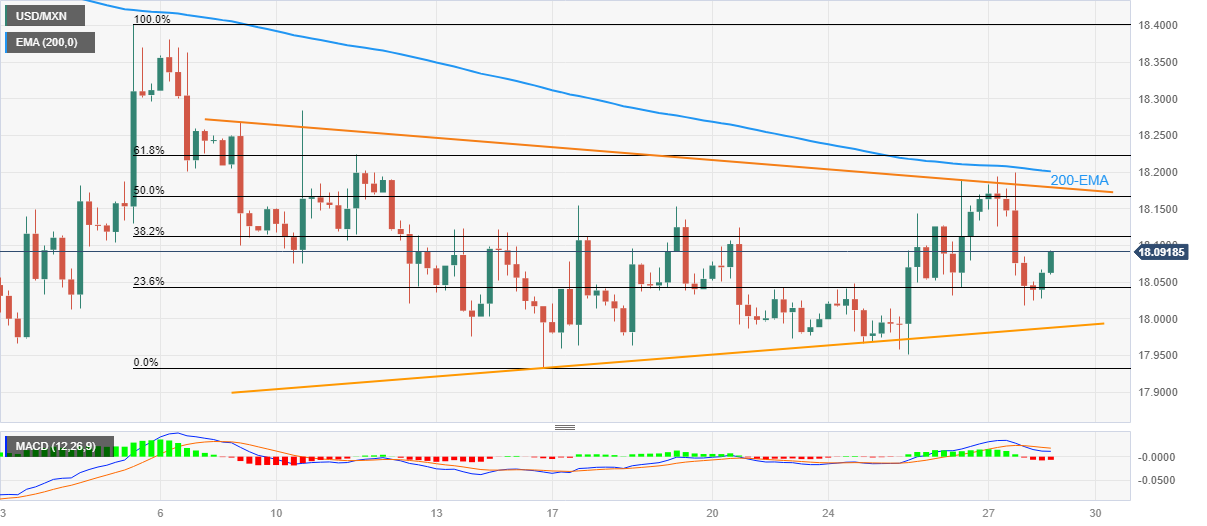
USD/MXN Price Analysis: Mexican Peso grinds near 18.00 within symmetrical triangle
- USD/MXN picks up bids to refresh intraday high, consolidates the biggest daily loss in a month.
- Bearish MACD signals challenge Mexican Peso sellers, 200-EMA acts as additional upside hurdle for the pair.
- Multiple levels towards the south challenge USD/MXN bears inside three-week-old triangle.
USD/MXN renews its intraday high near 18.09 as it pares the biggest daily loss in one month during early Friday. In doing so, the Mexican Peso (MXN) pair remains inside a three-week-old symmetrical triangle, reversing the pullback from the top of late.
It’s worth noting that the pair’s repeated failures to cross the 200-bar Exponential Moving Average (EMA) join bearish MACD signals to keep the USD/MXN bears hopeful despite the pair’s latest rebound.
That said, the 38.2% and 50% Fibonacci retracement levels of the USD/MXN’s April 05-16 fall, respectively near 18.11 and 18.16, act as nearby resistance for the buyers to watch before challenging the stated triangle’s top line, close to 18.18.
Following that, the 200-EMA level of 18.20 can act as the last defense of the bears before signaling a run-up toward the monthly high of near 18.40.
Alternatively, a 23.6% Fibonacci retracement puts the short-term price limit under the pair near 18.04, a break of which will highlight the aforementioned triangle’s lower line, currently around the 18.00 round figure.
In a case where the USD/MXN bears keep the reins, the monthly low near 17.93 and the previous monthly bottom surrounding 17.89 can prod the downside moves before signaling a fall towards the year 2017 trough of around 17.44.
USD/MXN: Four-hour chart

Trend: Limited recovery expected
