EUR/USD Price Analysis: Bears need to firm up at key resistance area
- EUR/USD bullish correction has started to decelerate at resistance and there are prospects of a move lower.
- EUR/USD bears eye 1.0905 as the first structural horizontal support that guards the 1.0880s support.
EUR/USD has traded between a low of 1.0887 and a high of 1.0920 on the day so far, correcting from the lows but well below the six-week peak of 1.100 touched on June 22. The potential economic consequences of higher interest rates within the Eurozone have trumped the hawkish tilt at the European Central Bank following the recently released PMI data from Friday that showed a notable deceleration in private sector growth across the Eurozone in June. Technically, the following illustrates a bearish bias while below the key resistance structure.
EUR/USD weekly chart
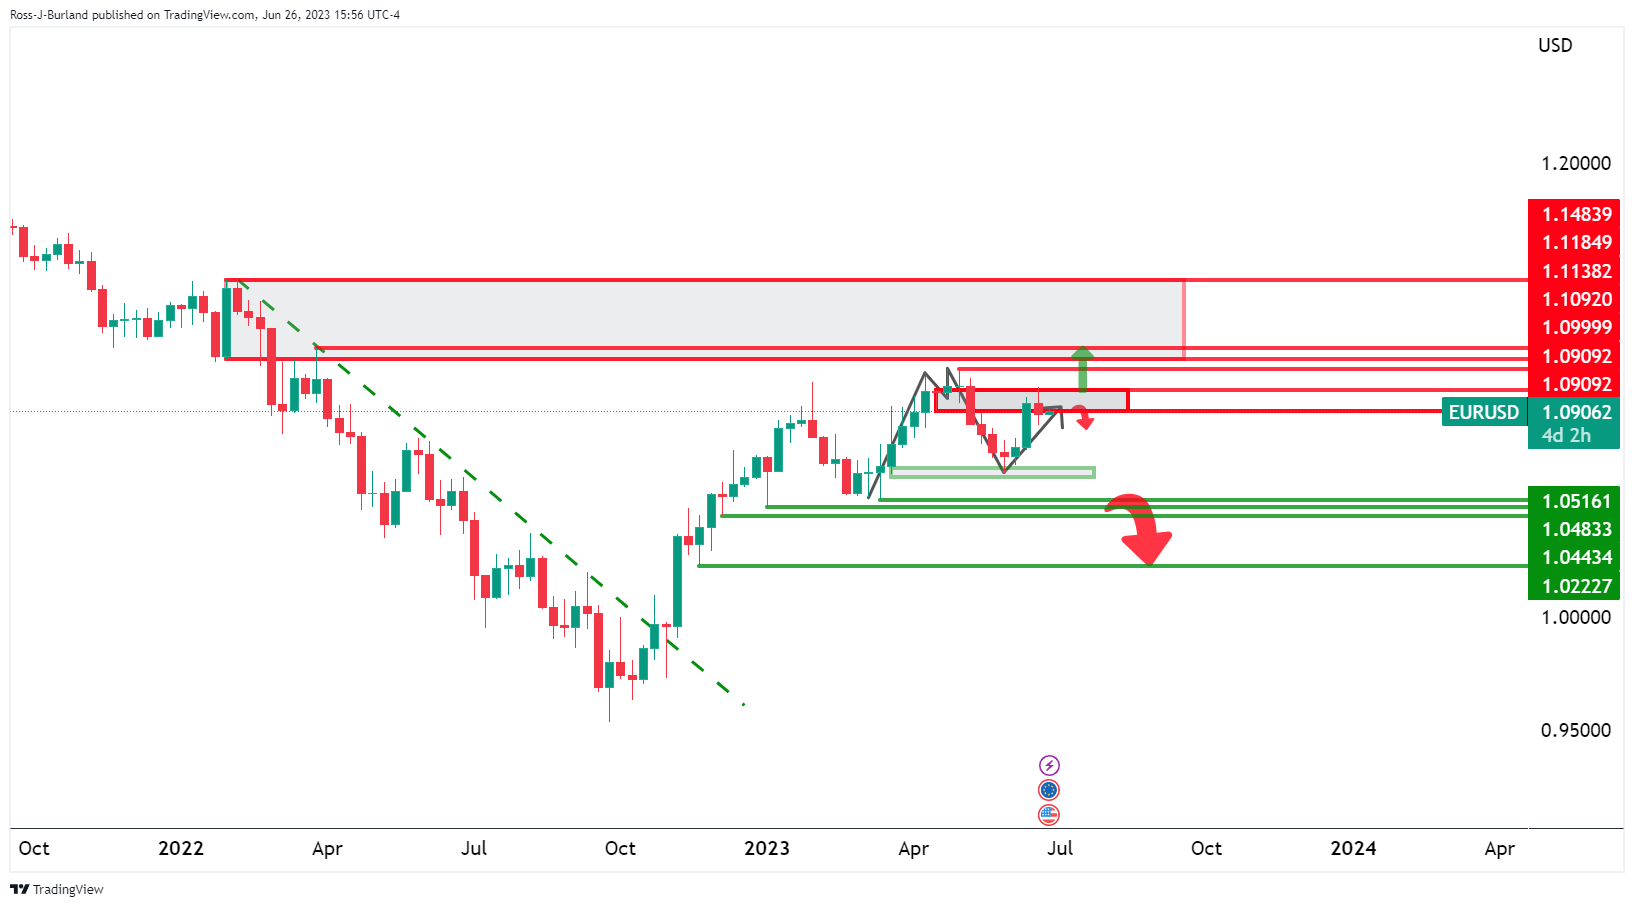
The weekly chart's M-formation has seen a reversion into the neckline resistance that would be expected to hold the bulls off, for now.
EUR/USD daily chart
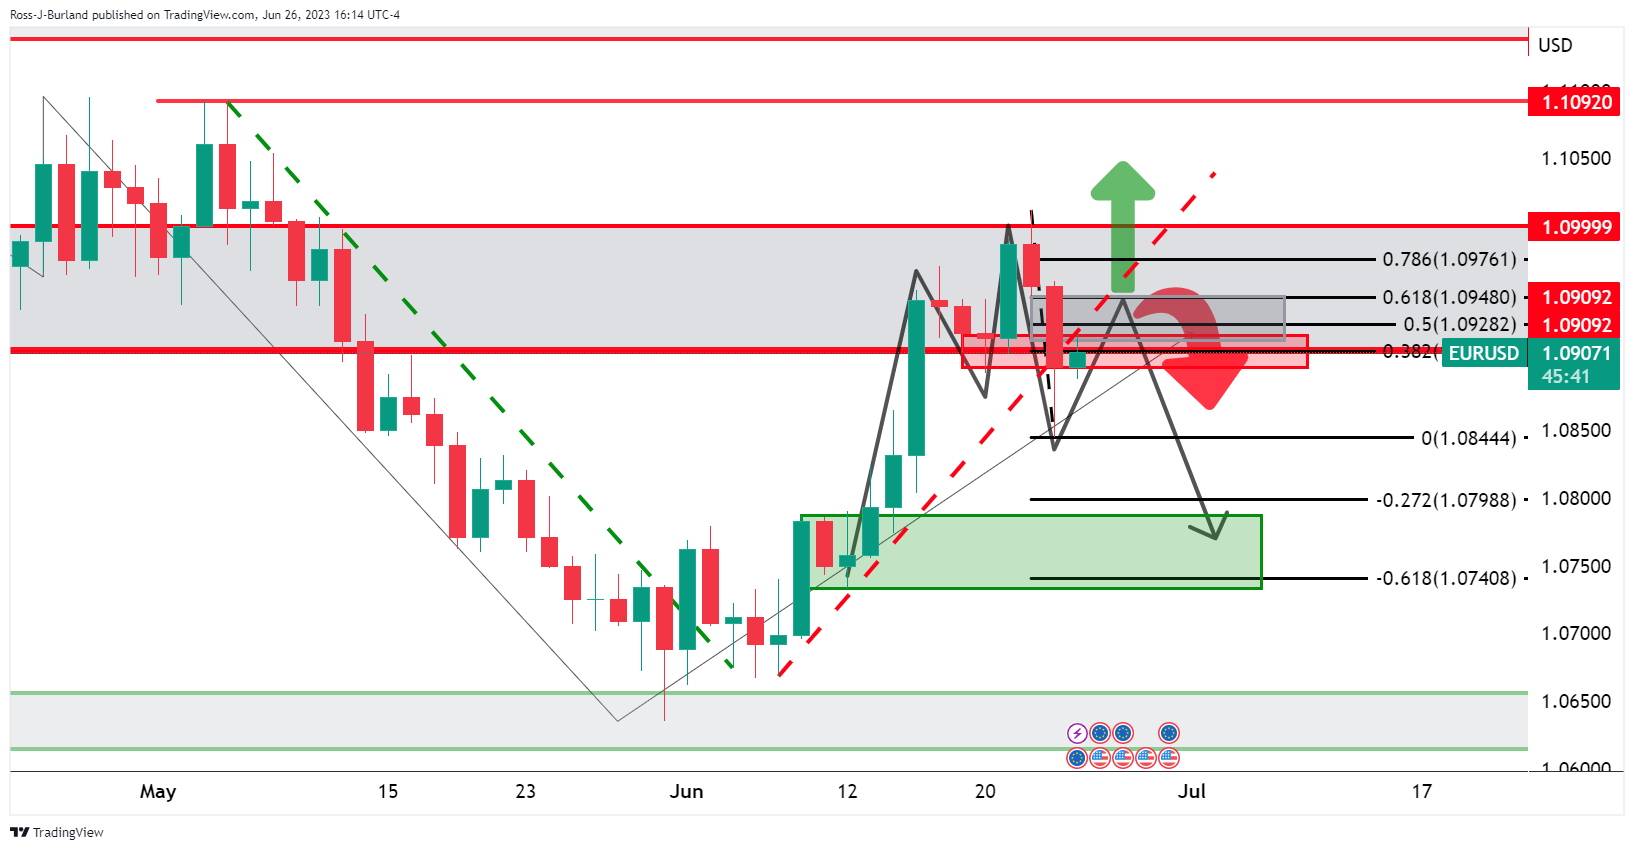
The daily M-formation is also in play but there is a price imbalance that could be filled as high as the 61.8% Fibonacci retracement level.
EUR/USD H1 chart
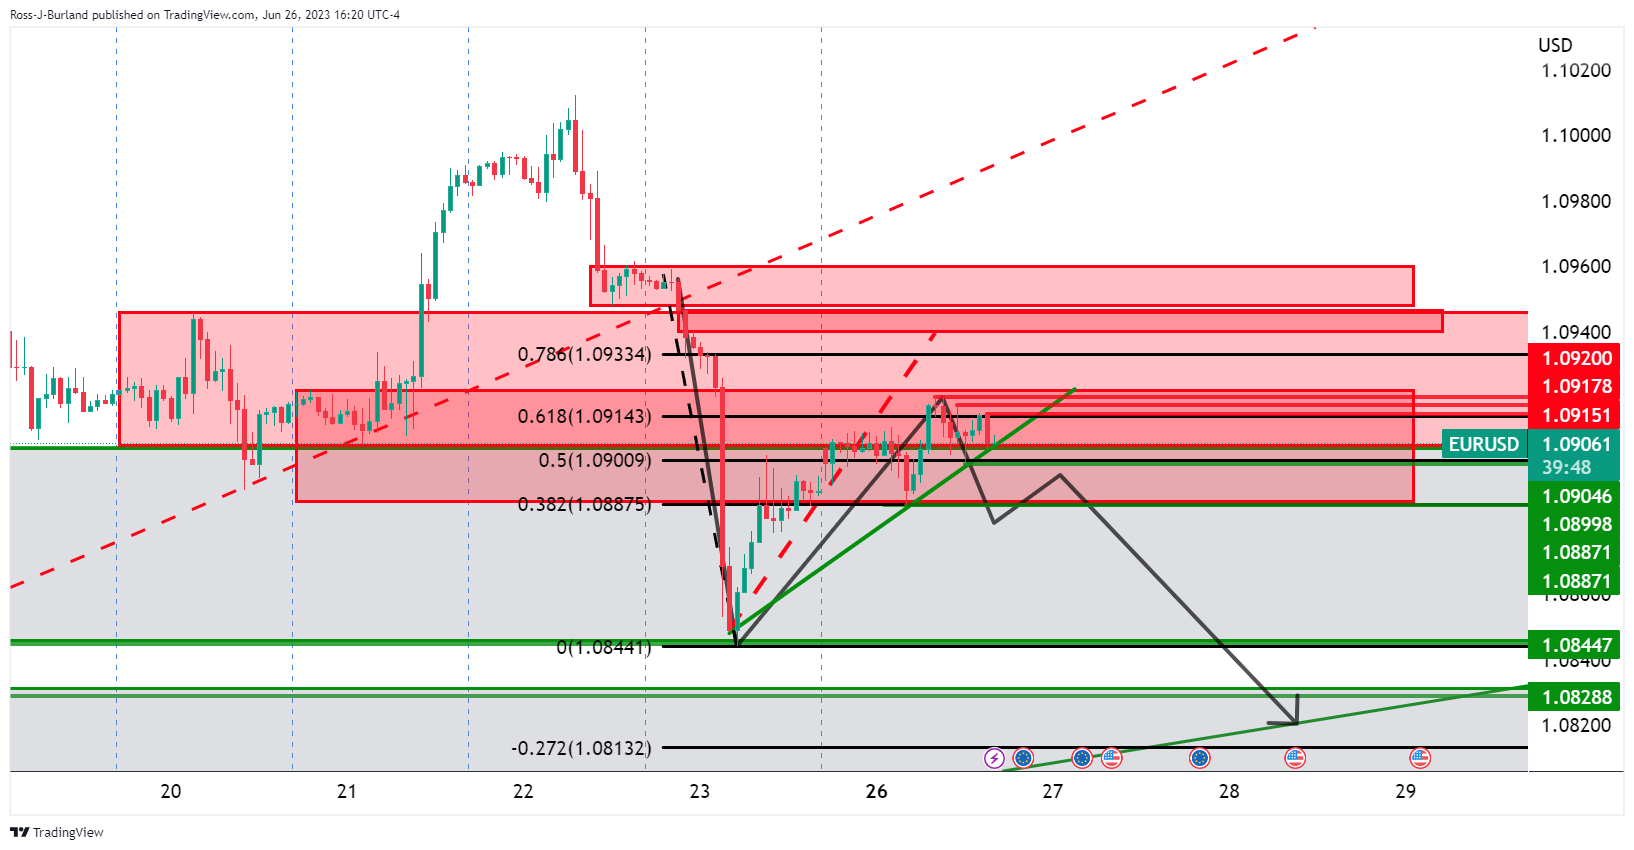
Meanwhile, the market is still on the front side of the hourly correction, at the extreme as illustrated in the chart above. However, it has started to decelerate at resistance and there are prospects of a move lower with 1.0905 as the first structural horizontal support that guards the 1.0880s support area as last defence for a move towards the lows, in the 1.0840s.