USD/CHF Technical Analysis: Greenback keeps the bullish mood going above the parity level
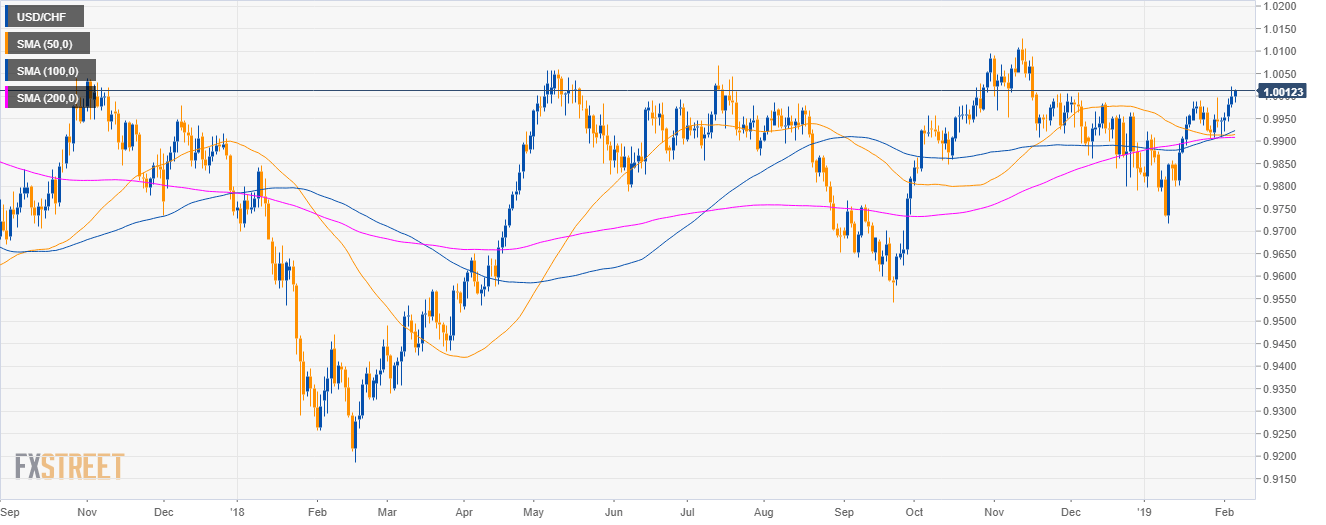
USD/CHF daily chart
- USD/CHF is trading in a sideways trend above the 50, 100 and 200-day simple moving averages (SMAs).
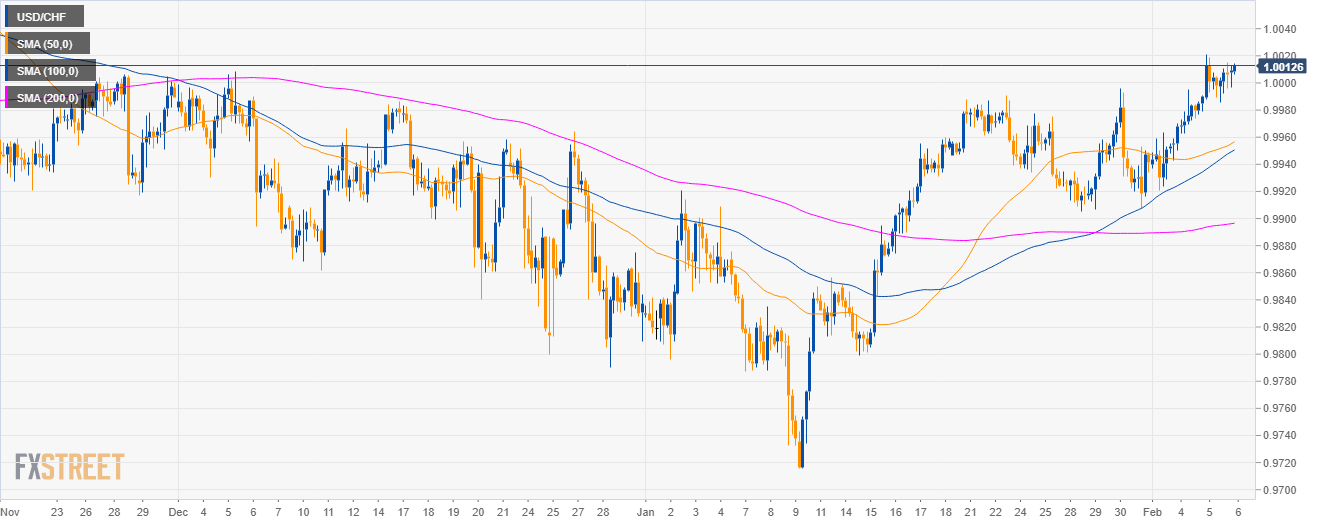
USD/CHF 4-hour chart
- USD/CHF is grinding up above the parity level.
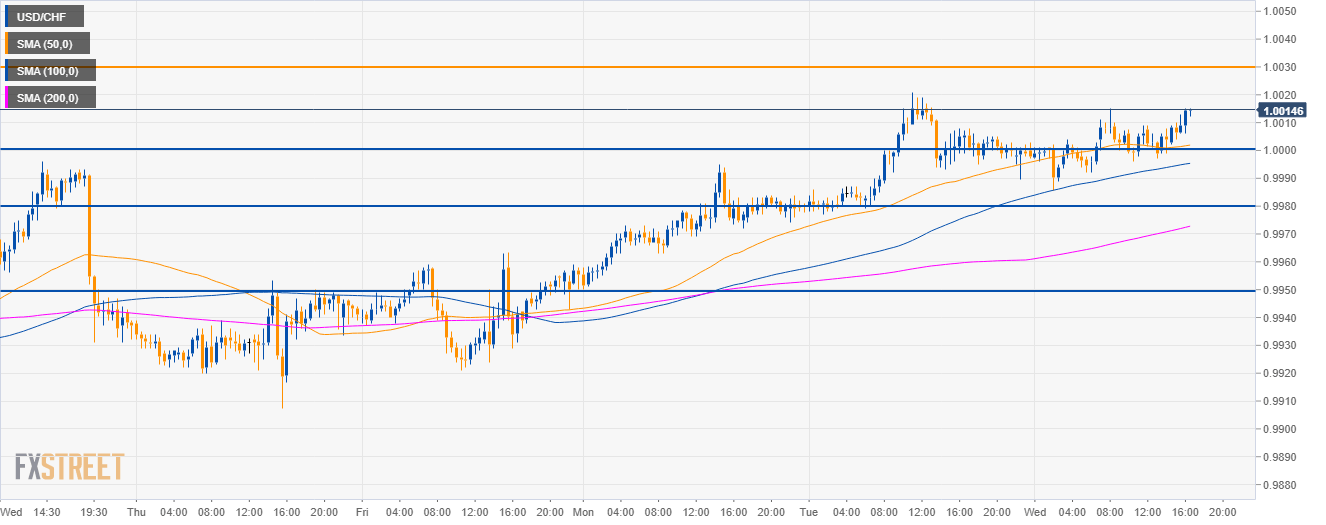
USD/CHF 30-minute chart
- USD/CHF is trading above its main SMAs suggesting bullish momentum.
- To the upside, the market could reach the 1.0030 and 1.0060 level.
- Pullbacks below 1.0000 could lead to the 0.9980 and 0.9950 level.
Additional key levels
USD/CHF
Overview:
Today Last Price: 1.001
Today Daily change: 11 pips
Today Daily change %: 0.11%
Today Daily Open: 0.9999
Trends:
Daily SMA20: 0.9919
Daily SMA50: 0.9913
Daily SMA100: 0.992
Daily SMA200: 0.9908
Levels:
Previous Daily High: 1.0021
Previous Daily Low: 0.9974
Previous Weekly High: 0.9996
Previous Weekly Low: 0.9905
Previous Monthly High: 0.9996
Previous Monthly Low: 0.9716
Daily Fibonacci 38.2%: 1.0003
Daily Fibonacci 61.8%: 0.9992
Daily Pivot Point S1: 0.9975
Daily Pivot Point S2: 0.9951
Daily Pivot Point S3: 0.9928
Daily Pivot Point R1: 1.0022
Daily Pivot Point R2: 1.0045
Daily Pivot Point R3: 1.0069