Back
8 Apr 2019
USD/CAD Technical Analysis: Greenback slumps to 1.3340 against CAD
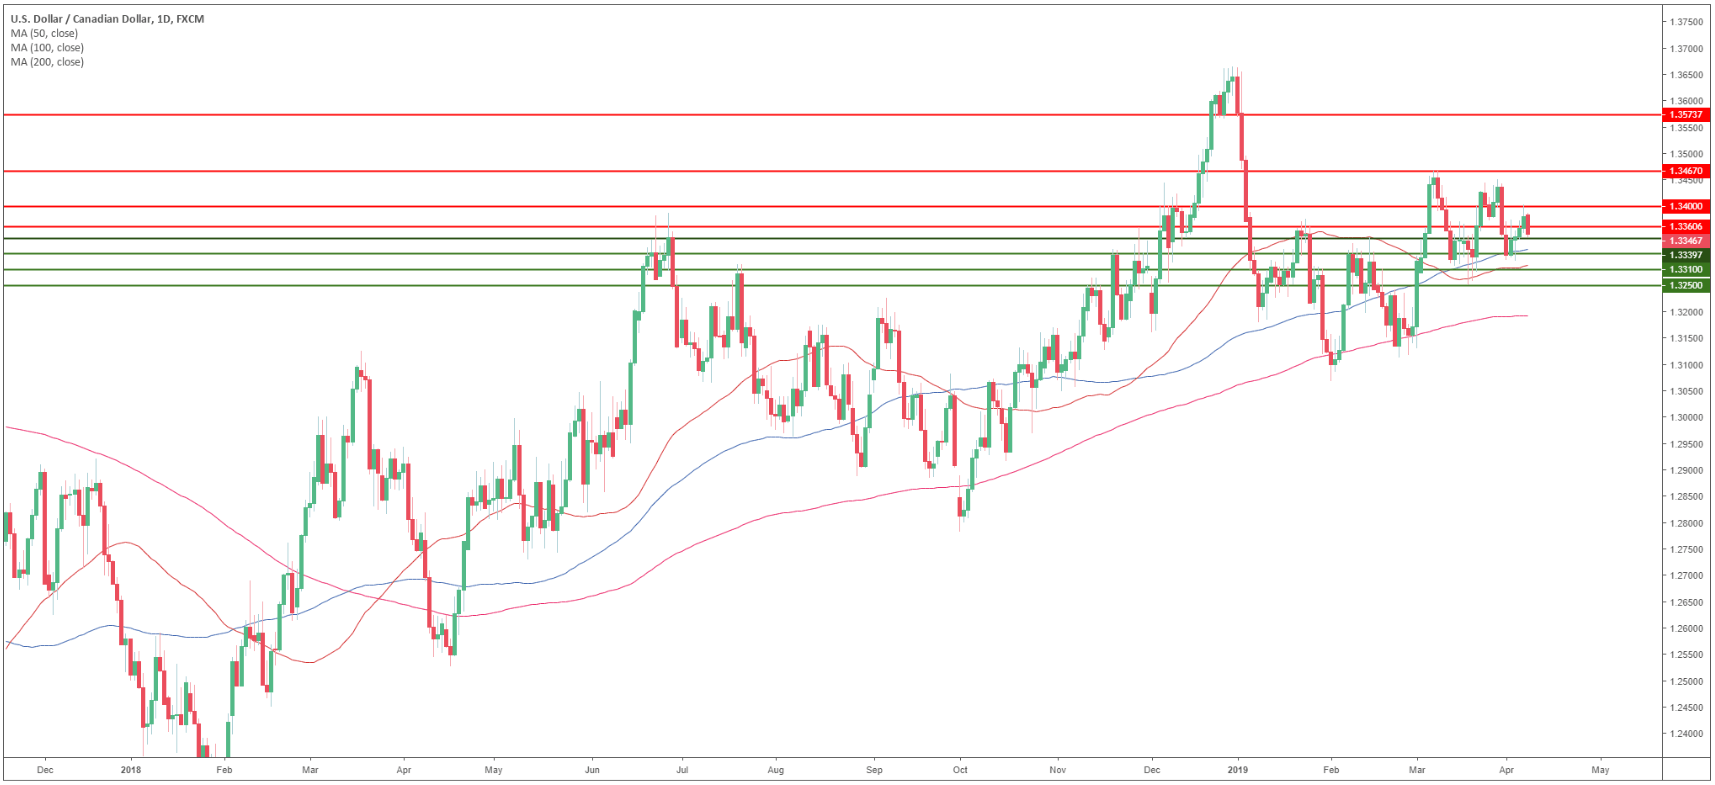
USD/CAD daily chart
- USD/CAD is trading in a bull trend above its main simple moving averages (SMAs).
USD/CAD 4-hour chart
- USD/CAD is trading between the 100 and 200 SMAs suggesting a consolidation in the medium-term.

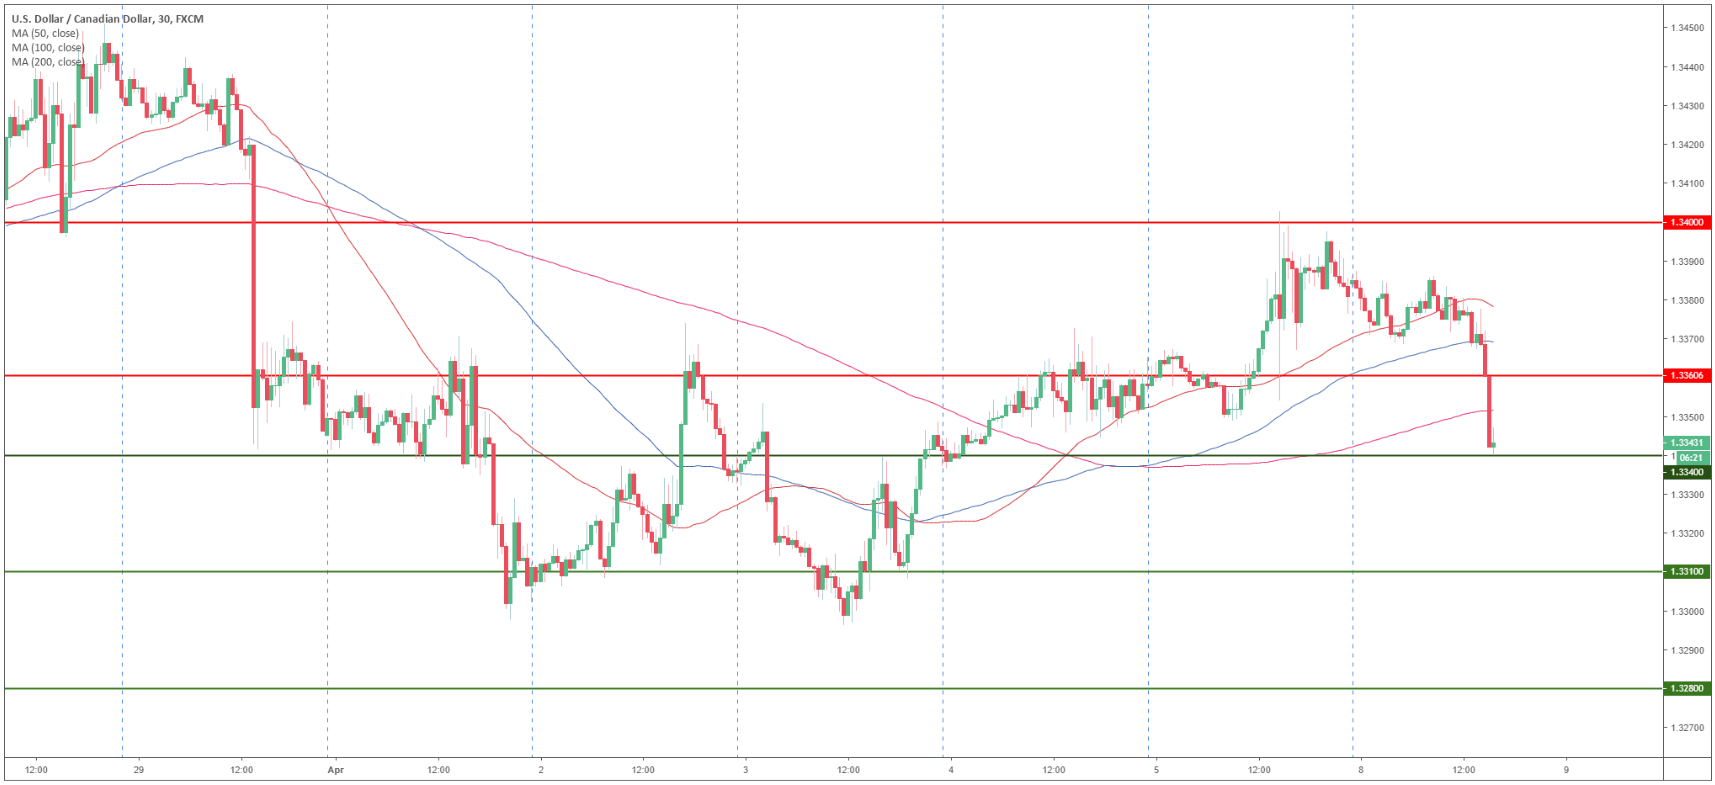
USD/CAD 30-minute chart
- USD/CAD is trading below its main SMAs suggesting bearish momentum in the short-term.
- Bears are in control and they will need a break below 1.3340 in order to move down towards 1.3310 and 1.3280 level.
- Key resistance is at 1.3360 and 1.3400 figure.
Additional key levels