Back
23 Jan 2020
Gold Price Analysis: XAU/USD bulls challenging 1573 resistance level
- The level to beat for bulls is the 1573 resistance on a daily closing basis.
- Support is seen near the 1555/1550 price zone.
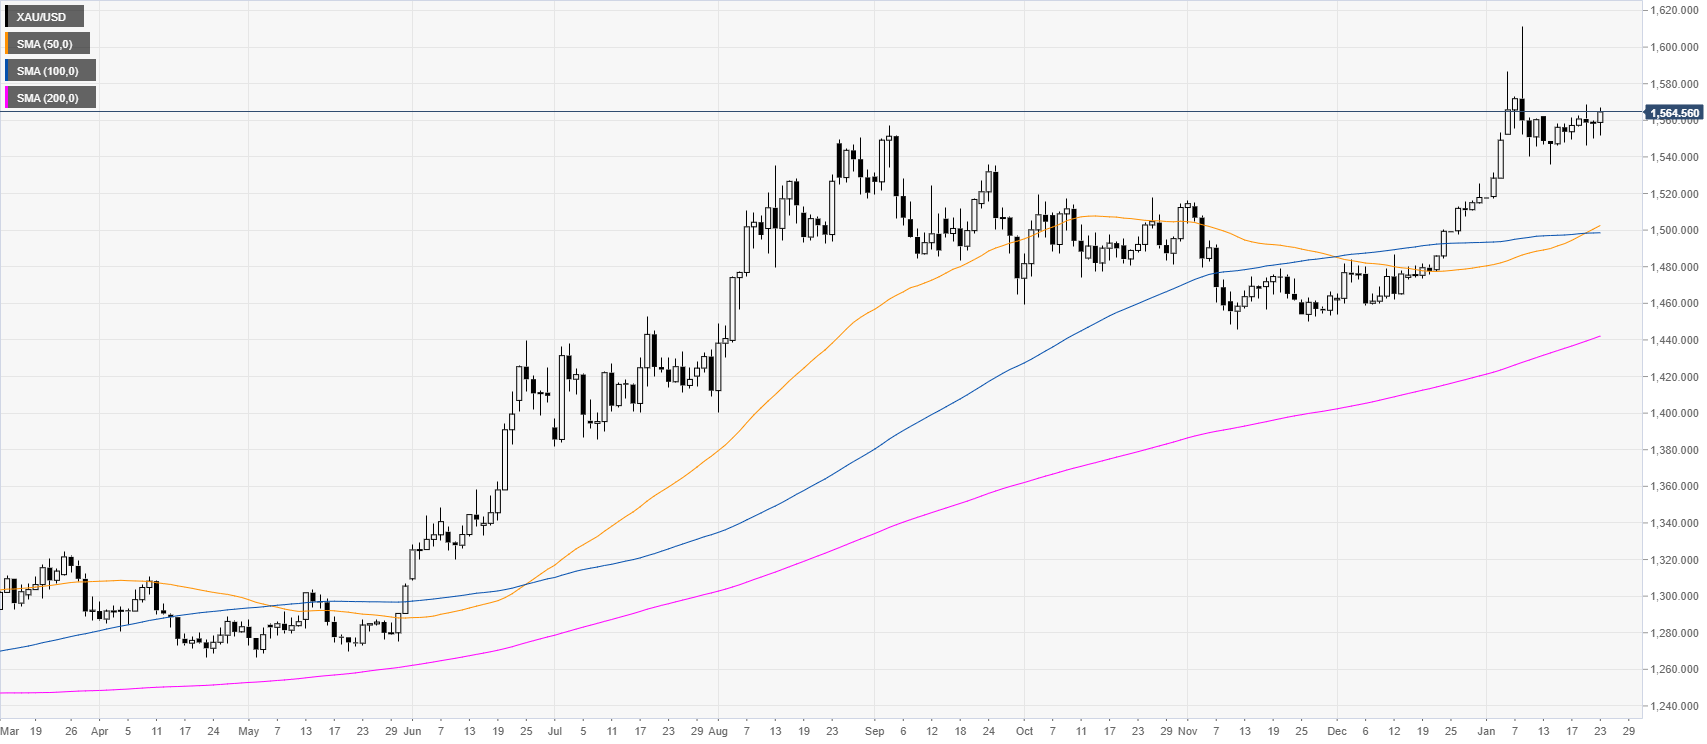
Gold daily chart
XAU/USD is trading in a bull trend above its main daily simple moving averages (SMAs). After rejecting the 1600 figure earlier in January, the metal has been consolidating near the $1560 per troy ounce.
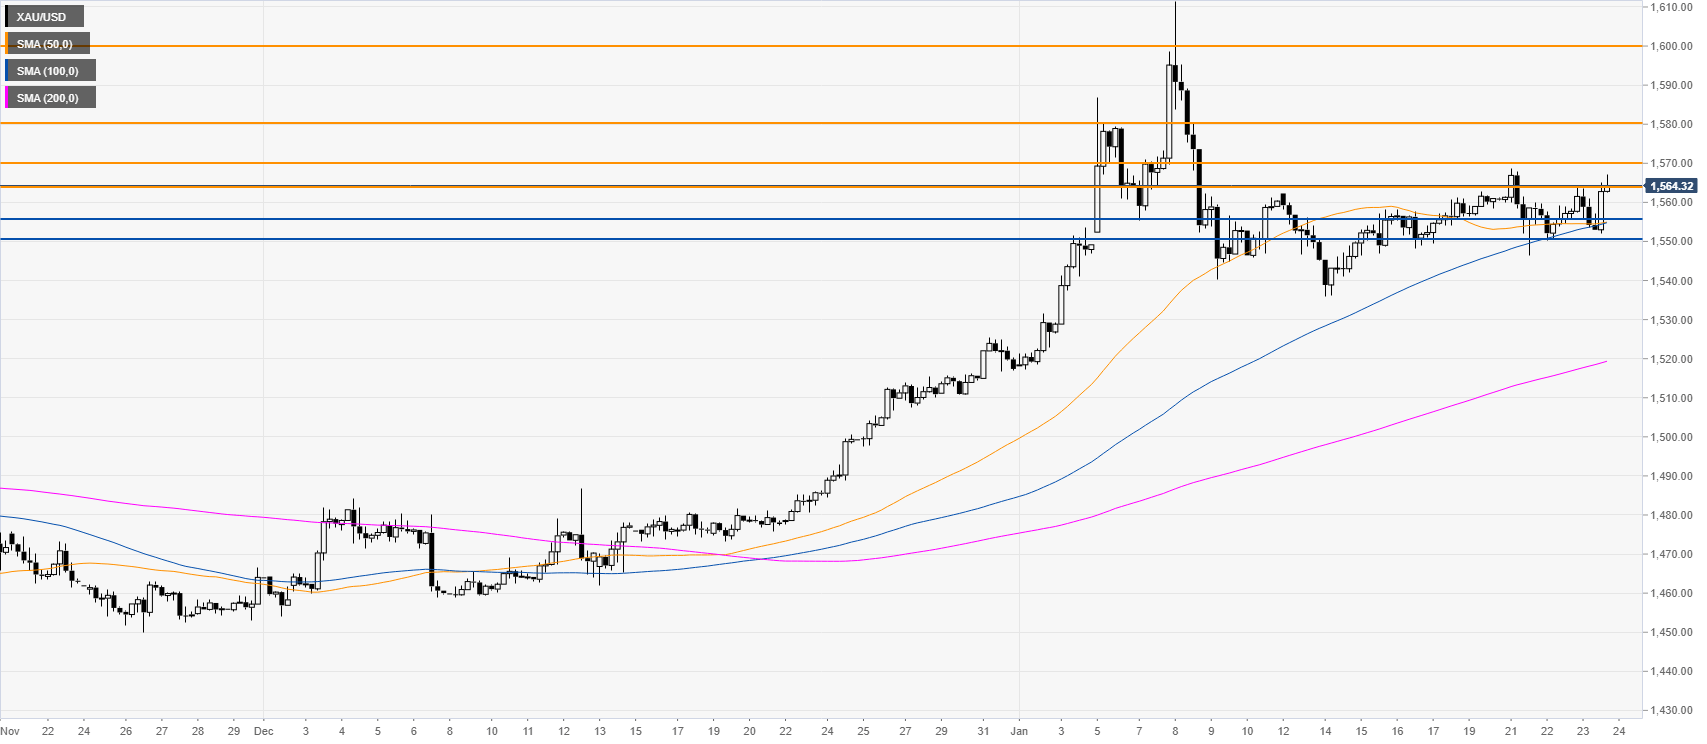
Gold four-hour chart
Gold is attempting to break above the 1573 resistance. A daily close above this level could lead to further upside towards the 1570 level. However, a failure near 1573 can see the market stay in its recent range and trade back to the 1555/1550 support zone.
Additional key levels