Back
24 Jan 2020
US Dollar Index Price Analysis: DXY nearing two-month’s highs, eyeing the 98.20 level
- The inverse head-and-shoulders pattern is lifting the market.
- The upside target can be located near the 98.20 level.
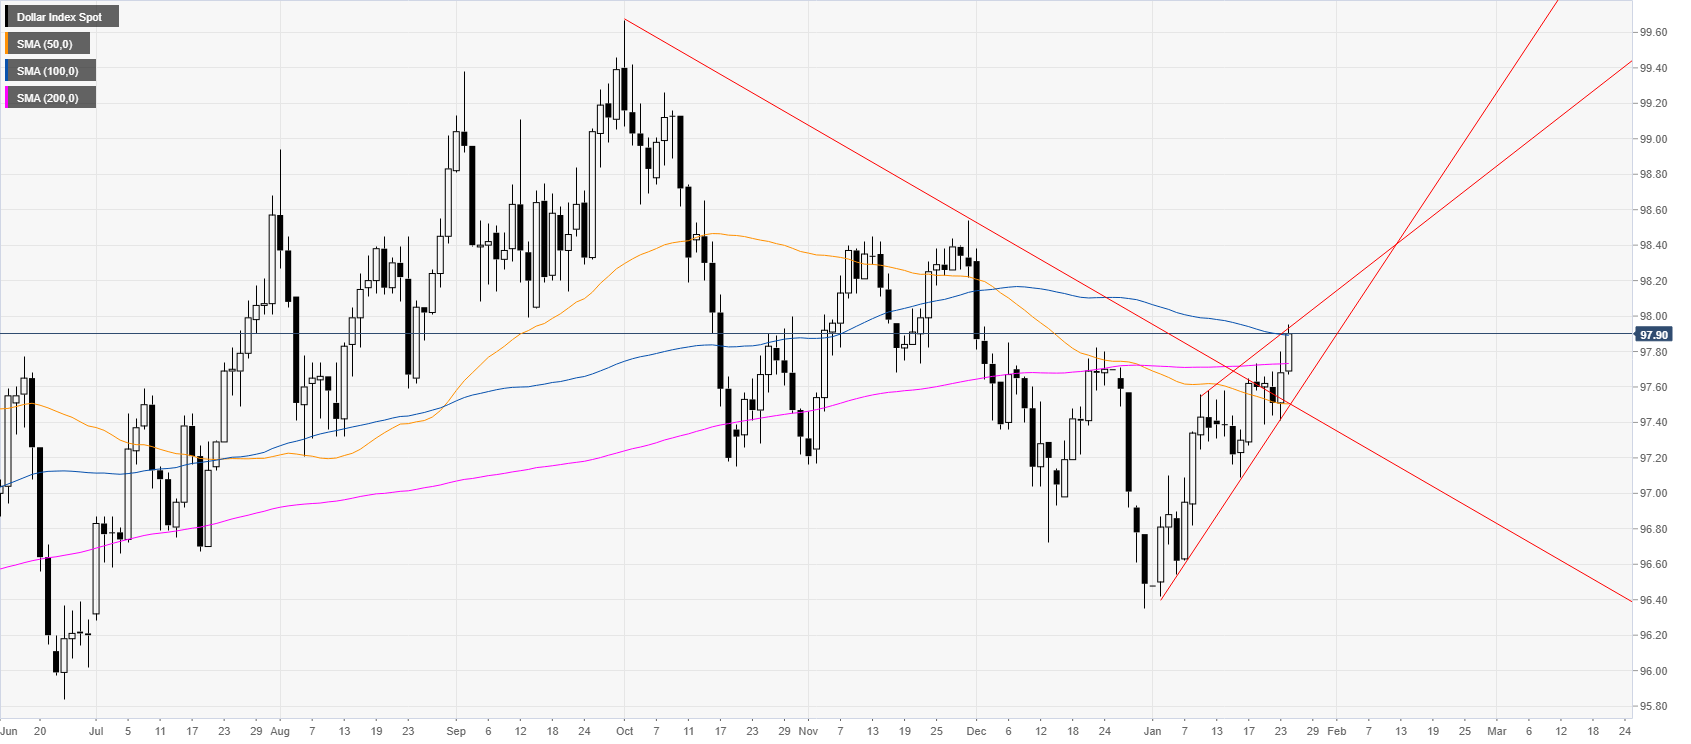
DXY daily chart
The US dollar index (DXY) is challenging the 100-day simple moving average (SMA) while trading within a bullish channel.
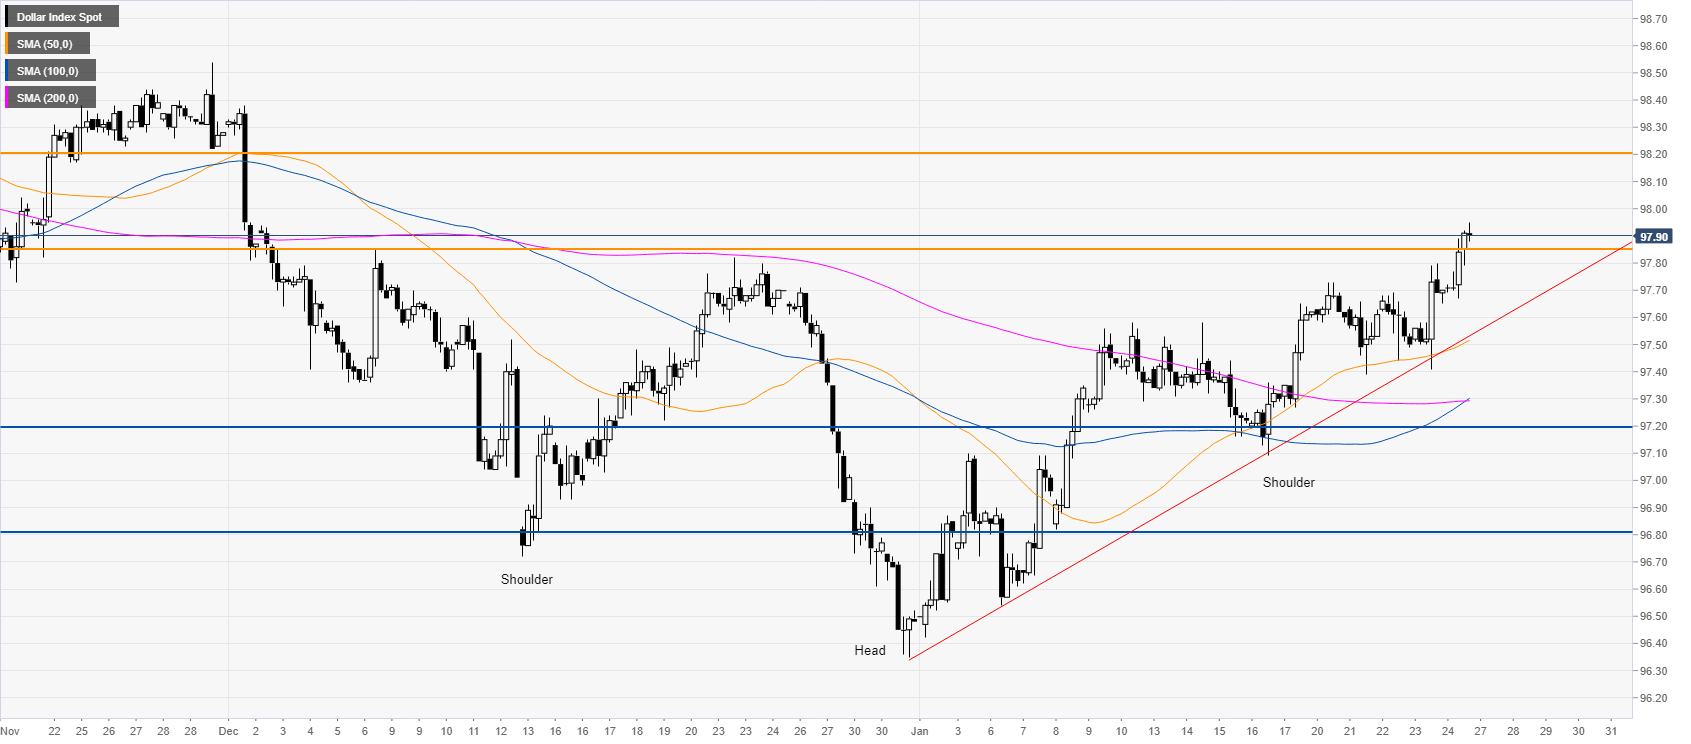
DXY four-hour chart
DXY is trading above the main simple moving averages (SMAs) and a bullish trendline, suggesting a constructive bias in the medium term. The greenback is breaking out from an inverted head-and-shoulders formation which is lifting the market above the 97.85 resistance and potentially targetting the 98.20 level on the way up.
Additional key levels