AUD/JPY Price Analysis: Buyers will look for entry above 74.00
- AUD/JPY forms a symmetrical triangle pattern amid bullish MACD.
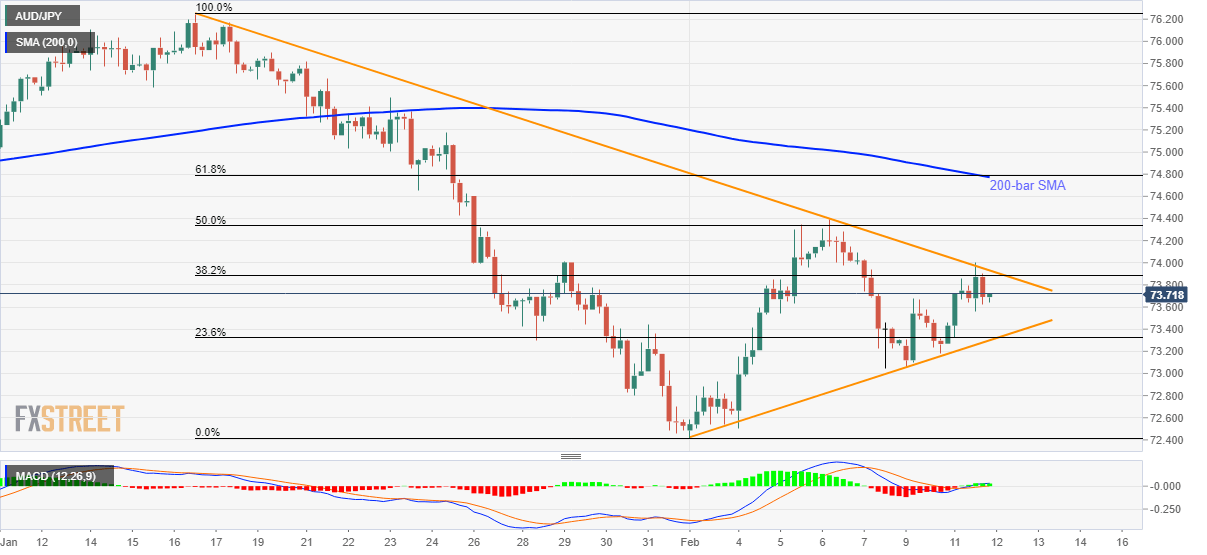
- 200-bar SMA, 61.8% Fibonacci retracement act as the strong resistance.
- Sellers will refrain unless the quote slips below 73.30.
AUD/JPY trades near 73.71 during the early Wednesday morning in Asia. In doing so, the pair remains inside the short-term symmetrical triangle formation. However, bullish MACD signals and a broad risk recovery seem to favor the quote’s further upside.
That said, the triangle’s resistance around 74.00 will be the trigger for the fresh run-up towards the last week’s top surrounding 74.40.
However, a confluence of 200-bar SMA and 61.58% Fibonacci retracement of the pair’s declines between January 16 and February 02, around 74.77/80, will be the key resistance holding the gate for the arrival of 75.00.
On the downside, the triangle support and 23.6% Fibonacci retracement limit the pair’s near-term declines close to 73.30.
Should AUD/JPY prices slip below 73.30, 73.00 and the monthly low around 72.40 will return to the charts.
AUD/JPY four-hour chart
Trend: Further recovery expected