Back
12 Feb 2020
US Dollar Index Price Analysis: DXY clings to 2020 highs, bulls eye the 99.00 figure
- DXY is nearing the 99.00 figure as the market is printing fresh 2020 highs.
- The level to beat for bulls is the 99.00 figure followed by the 99.40 level.
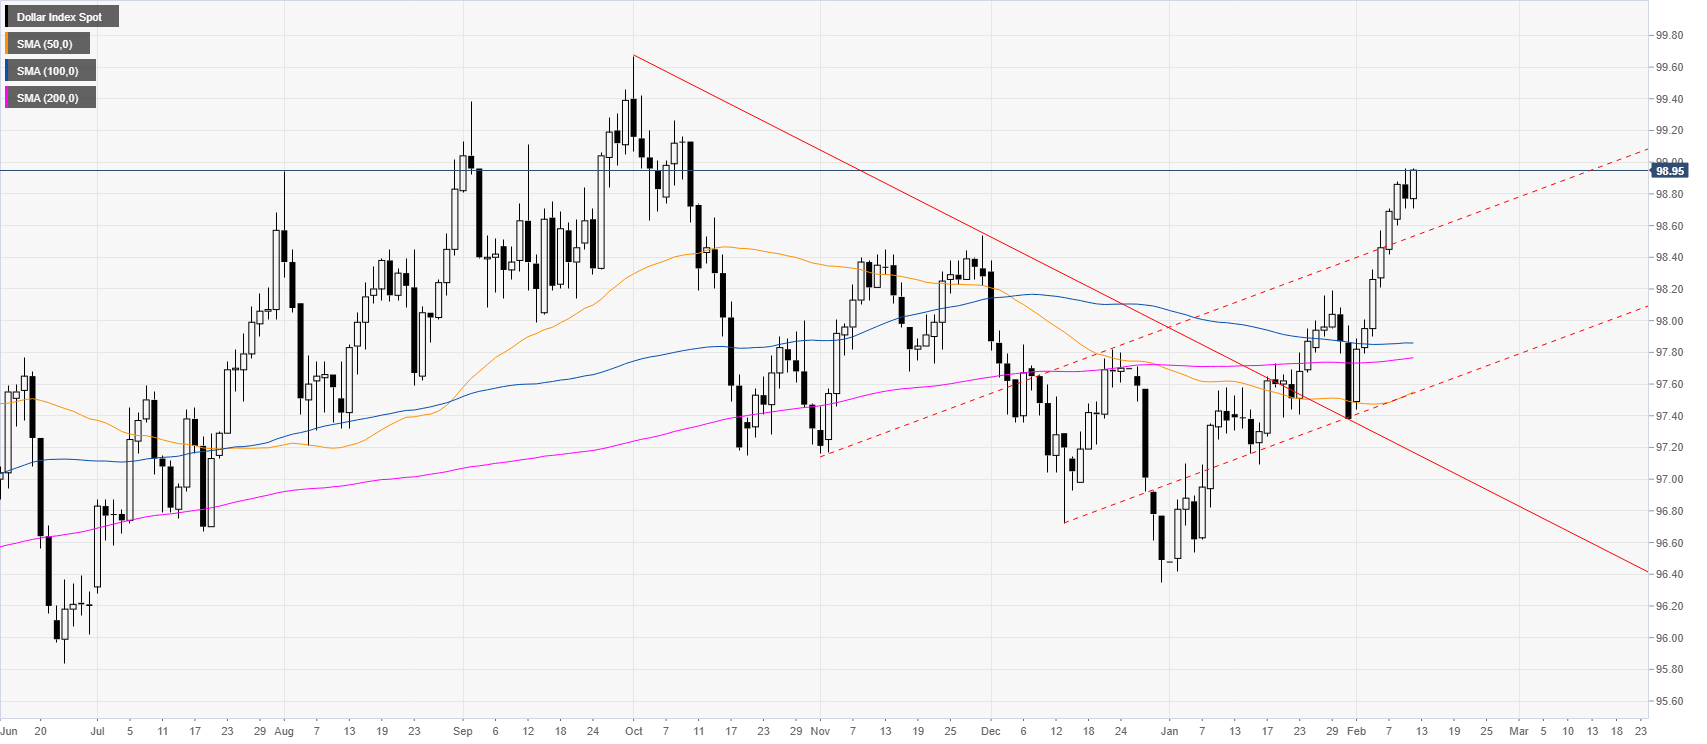
DXY daily chart
The US dollar index (DXY) is trading near its highest point since October while trading above its main daily simple moving averages (SMAs). The market corrected on Tuesday after six consecutive bull days and DXY is now en route to retest the 2020 high.
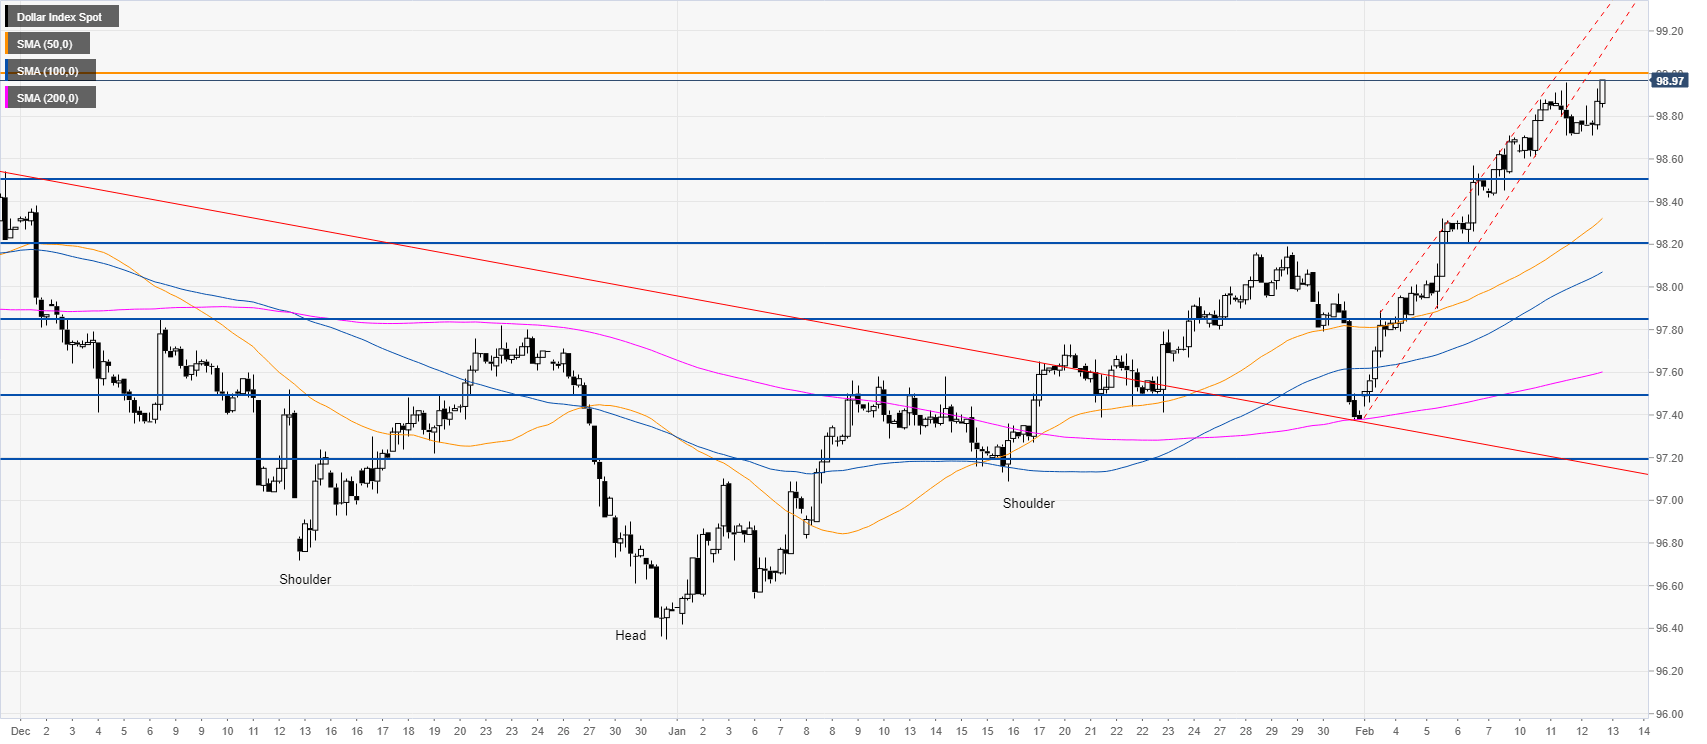
DXY four-hour chart
DXY broke down from a tight bull channel and is now en route towards the 99.00 figure. If the buyers can break the 99.00 mark, the uptrend can extend towards the 99.40 level. Although the bias remains tilted to the upside, the market can be exhausting itself and at risk for a short term pullback down towards the 98.50 and 98.20 levels.
Additional key levels