Back
28 Feb 2020
USD/INR New York Price Forecast: Dollar approaching the 2020 highs near 73.00 figure vs. rupee
- USD/INR is pressuring the 72.40 resistance.
- USD/INR bulls are looking at the 2020 highs and the 73.00 figure.
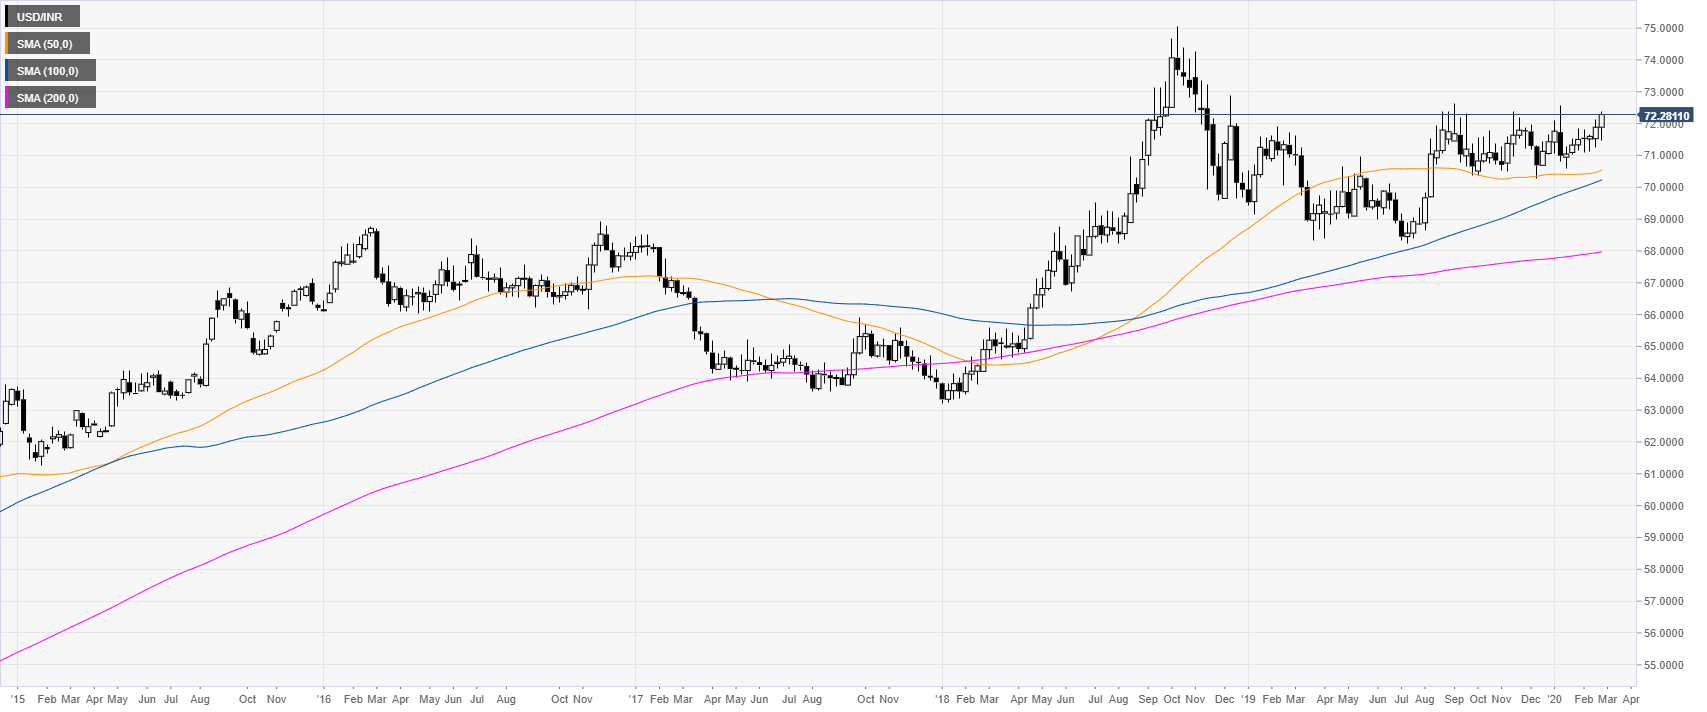
USD/INR weekly chart
After the 2018 bull-run, USD/INR has been consolidating in a rectangle pattern. The spot is trading above the main weekly simple moving averages (SMAs), suggesting a bullish bias in the long term.
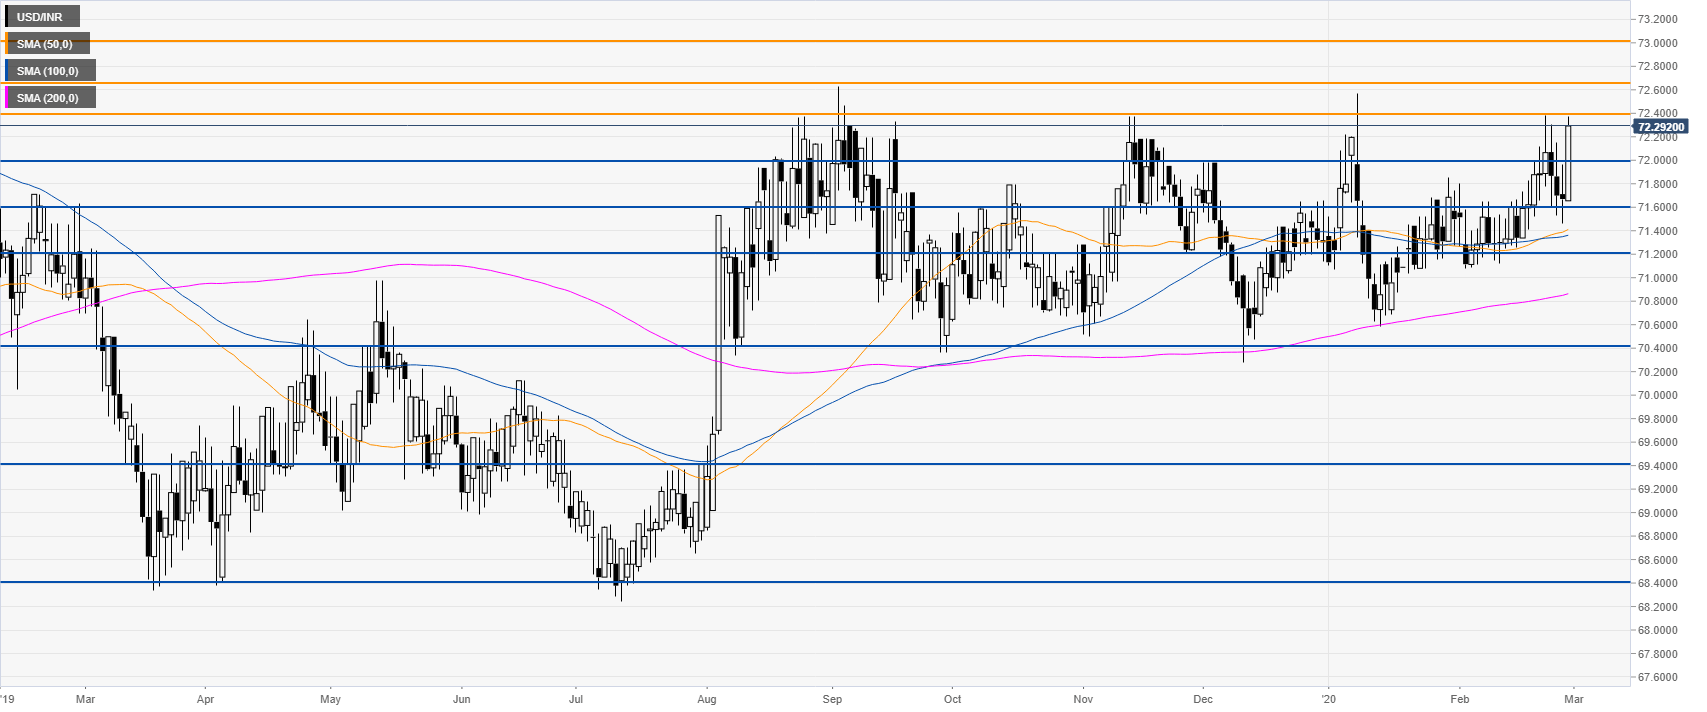
USD/INR daily chart
The spot is challenging the 72.40 resistance while trading above the main SMAs on the four-hour chart. As bulls are pressuring the resistance a break above it can lead to further gains towards the 72.65 and 73.00 levels. Support is seen near the 72.00 and 71.60 levels.
Additional key levels