Back
9 Mar 2020
AUD/USD Price Analysis: Aussie recovers from 11-year lows, trades in two-week’s high near
- AUD/USD bounces sharply from 11-year lows.
- A bullish correction could be on the cards.
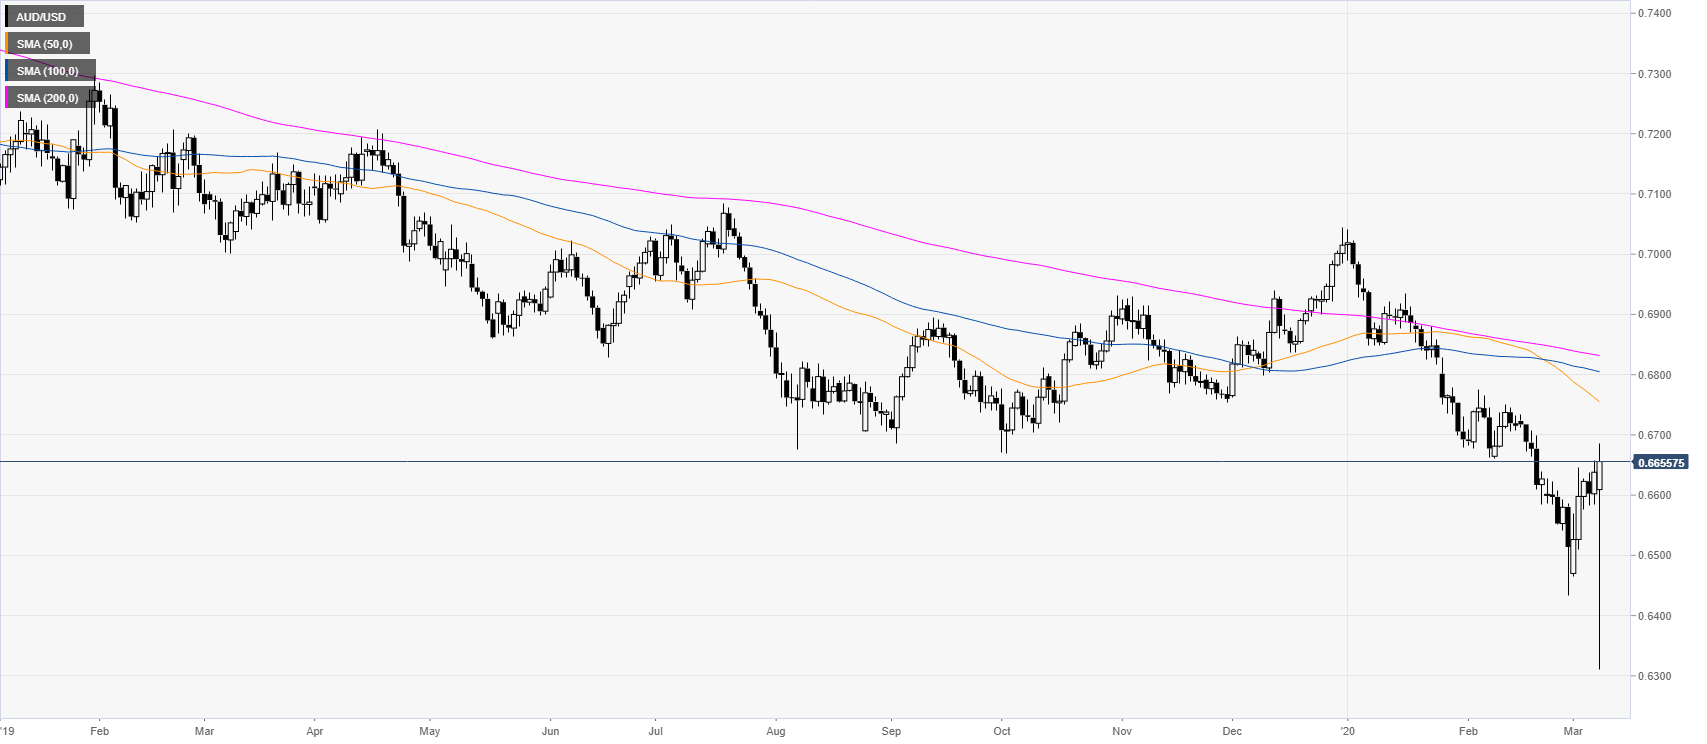
AUD/USD daily chart
After crashing near 0.6300 figure the aussie is recovering and adding about 250 pips from 11-year lows while trading well below the main daily simple moving averages (SMAs).
AUD/USD four-hour chart
AUD/USD is trading at fresh highs in March as the market is reversing up sharply and challenging the 200 SMA on the four-hour chart. A sustained break above the 0.6672 resistance can lead to extra gains as bulls seem to be back in the driver’s seat. Levels to watch to the upside can be loctaed near the 0.6714 an 0.6749 resistances. Support, on the other hand, could be found on any drop to the 0.6631, 0.6617 and 0.6589 levels, according to the Technical Confluences Indicator.
Resistance: 0.6672, 0.6714, 0.6749
Support: 0.6631, 0.6617, 0.6589
Additional key levels