USD/ZAR Price Analysis: Depressed below 17.00 inside monthly falling channel
- USD/ZAR bears catch a breather around three-month low close to 16.60.
- A two-week-old falling support line might challenge immediate downside.
- Bulls could remain cautious unless breaking 200-bar SMA.
USD/ZAR eases from 16.68 to 16.63 amid the early Wednesday morning in Asia. Even so, the pair stays modestly changed while taking rounds to the three-month low of 16.5900 flashed the previous day.
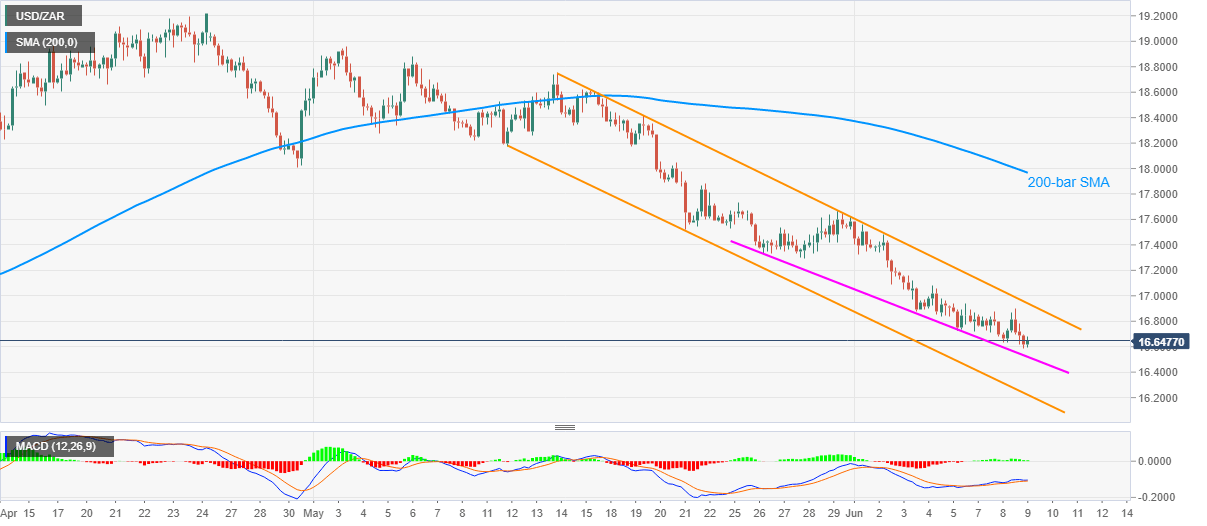
On the 4-hour chart, the pair portrays a short-term falling trend channel that describes the bears’ dominance over the momentum.
However, a falling trend line from May 26, around 16.52 now, may offer intermediate support to the pair ahead of dragging it to the channel’s lower line around 16.20.
During the pair’s further declines below 16.20, the 16.00 round-figure and the early-March top near 15.80 could please the bears.
On the upside, a clear break of the said channel’s resistance line near 16.95 can trigger the pair’s recovery moves towards 200-bar SMA level close to 18.00. It should, however, be noted that the buyers might keep the skepticism unless the quote breaks 200-bar SMA, which in turn holds the key to its run-up towards the mid-May high near 18.75.
USD/ZAR four-hour chart
Trend: Bearish