EUR/USD Price Analysis: Trapped below houly resistance, but firm above weekly support
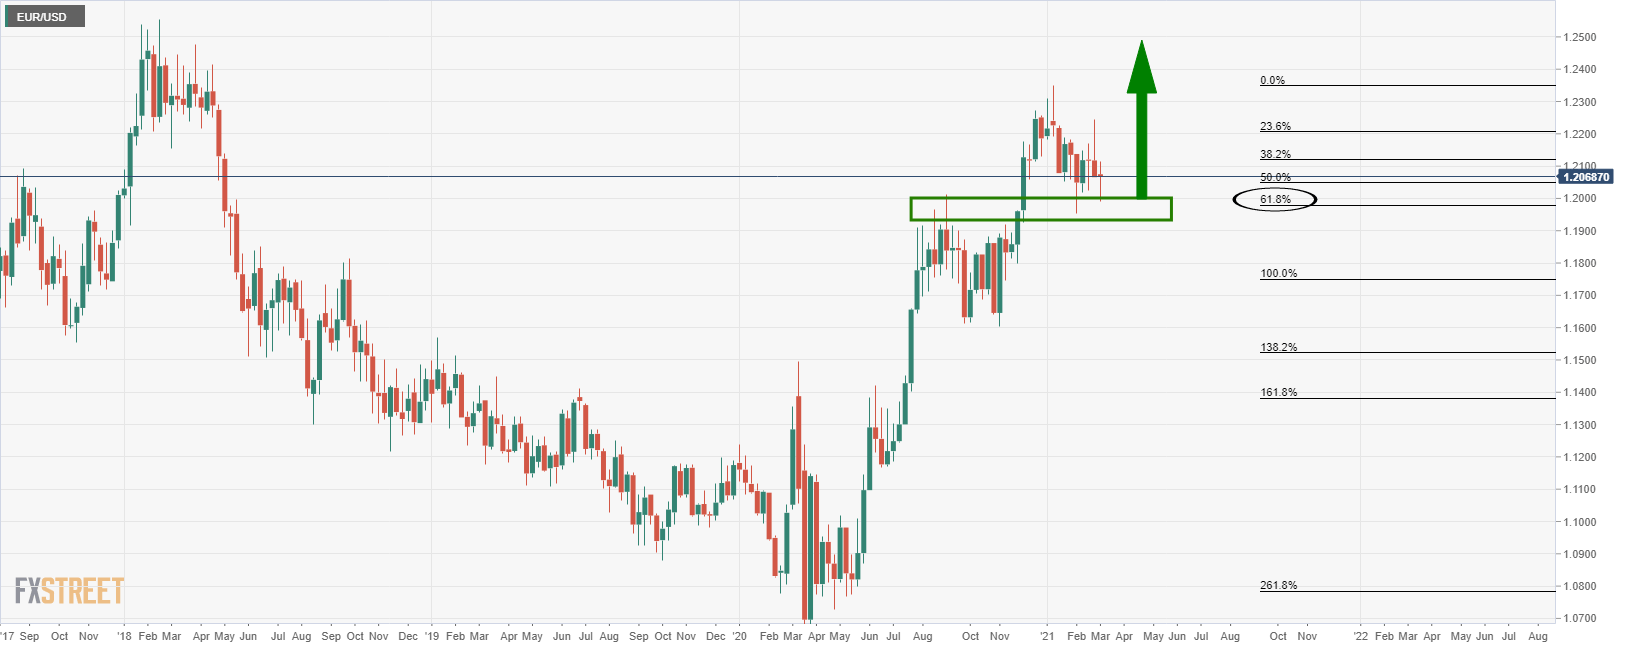
- EUR/USD on the verge of an upside extension from weekly support.
- The US dollar is treading on thin ice, DXY vulnerable to a break below daily 38.2% Fibo.
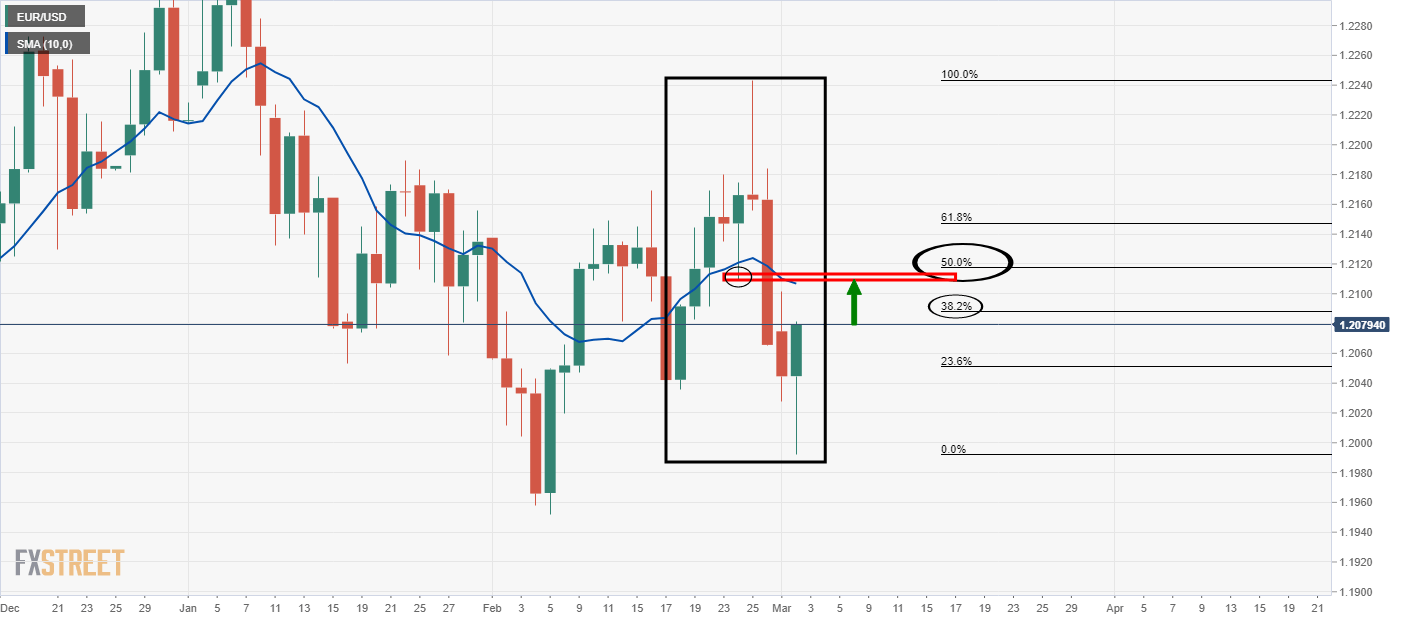
As per the prior analysis, EUR/USD Price Analysis: Bulls on track for test of 1.2110 while above1.2050's, the price has indeed moved in on the target and reached a high of 1.2113 before falling back on support in the 1.2050 area.
Prior analysis
The M-formation is a bullish pattern where the price would be expected to revert back to test the neckline and prior support, or, to at least the 38.2% Fibonacci level.
Daily chart
Live market
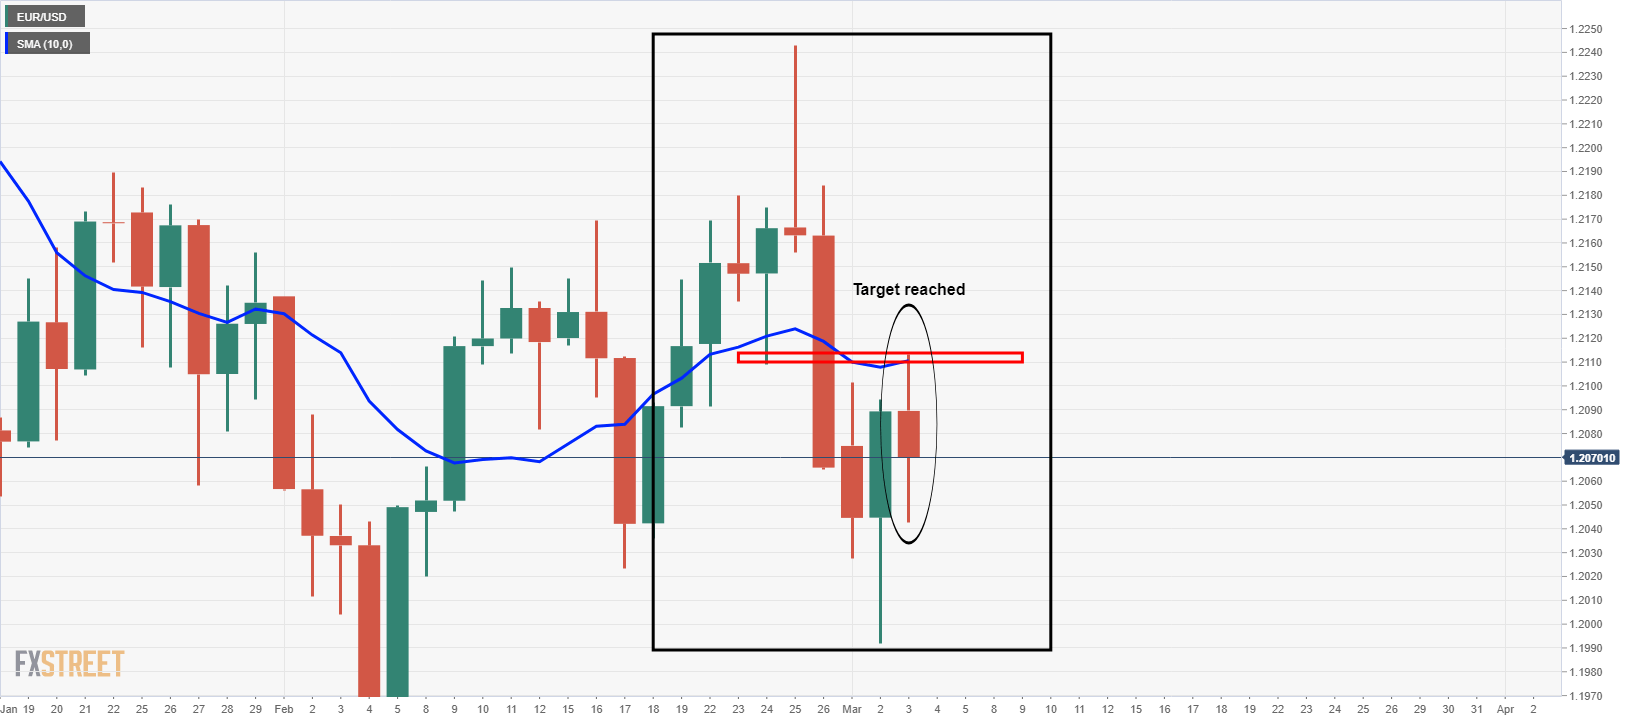
As illustrated, the price reached the target, but is now trapped between hourly support and resistance as follows:
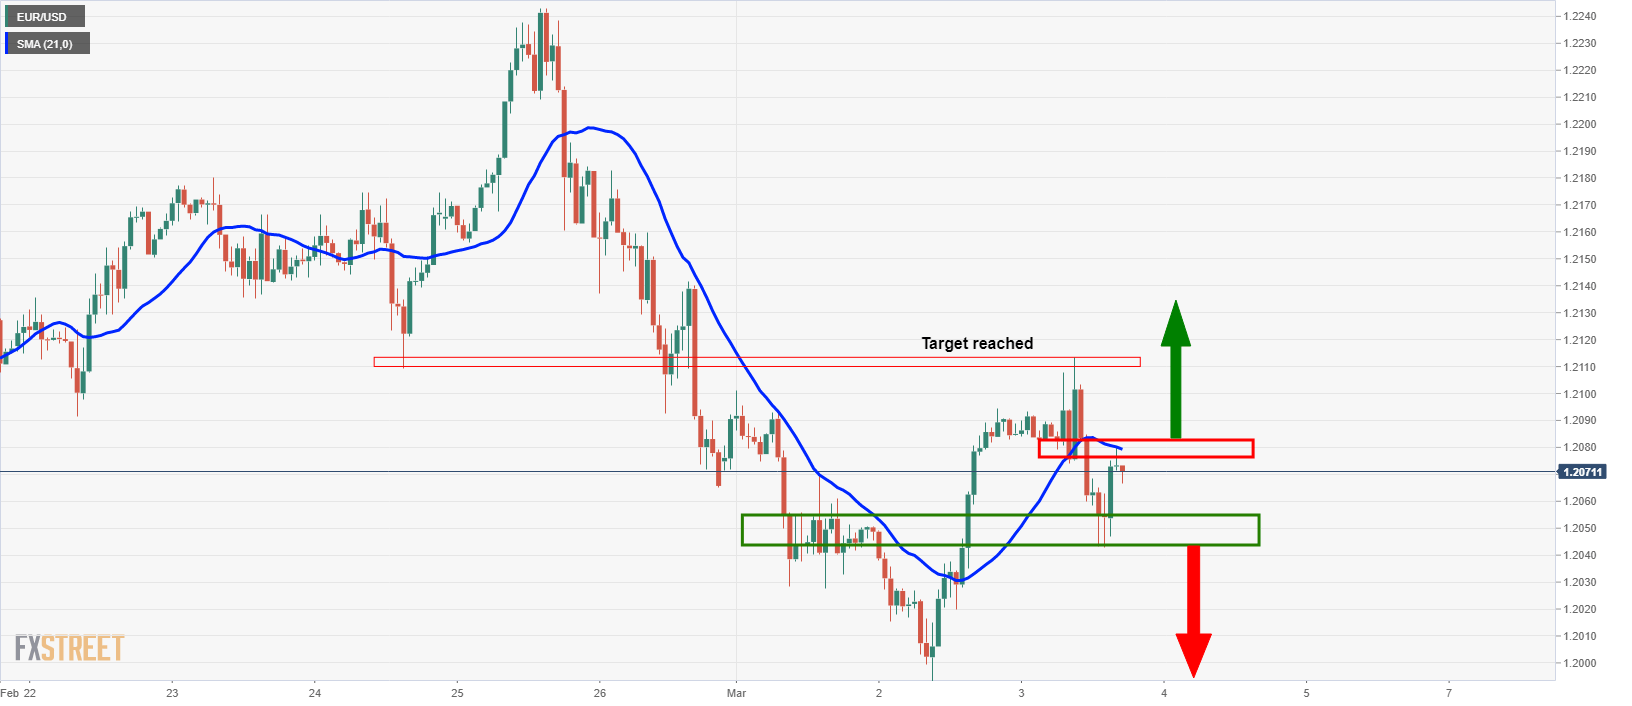
The price is trading below the 21-hour SMA which has a confluence with prior lows that are now acting as resistance.
There are prospects of a downside continuation on a break below 1.2040.
Meanwhile, the DXY is a mixed technical picture from a daily perspective:
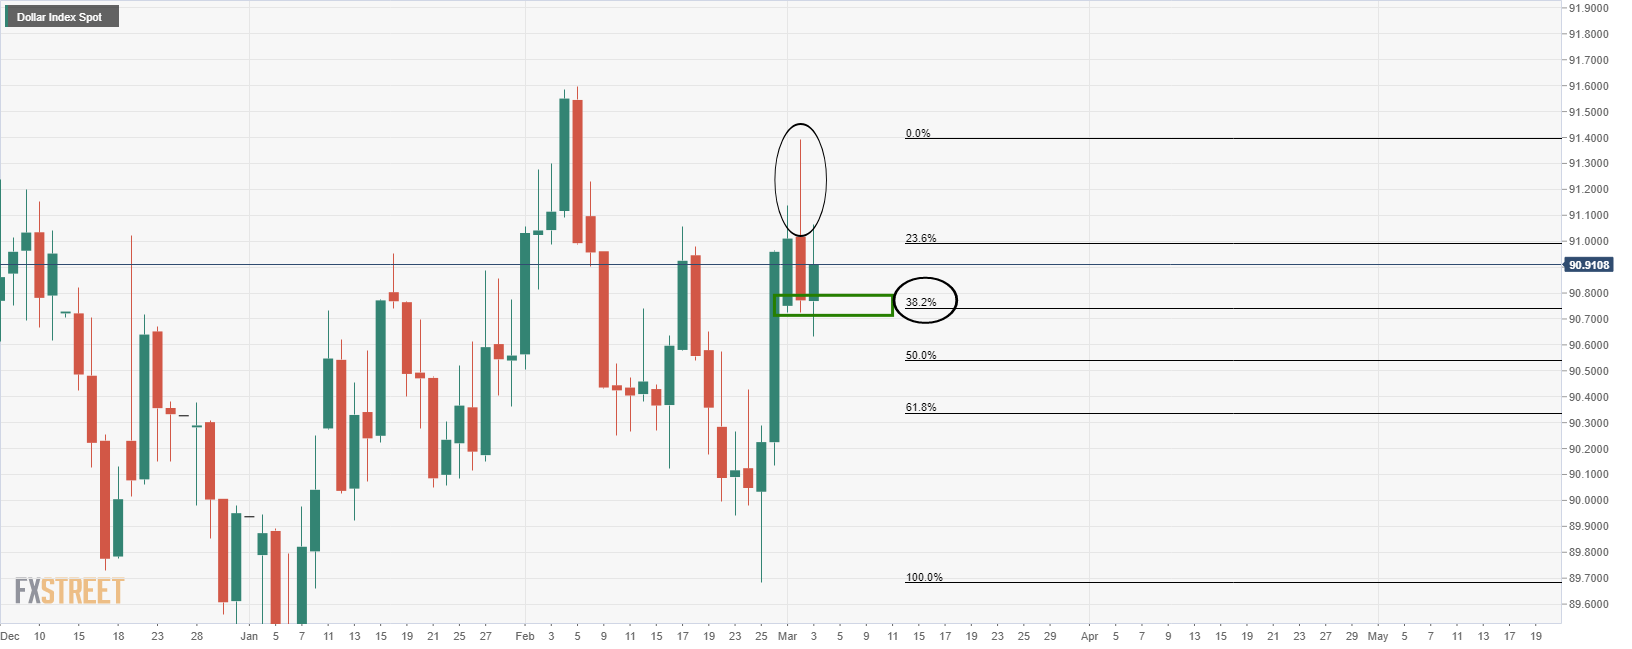
There has been a huge rejection which has left a bearish wick while, at the same time, the price has corrected to a 38.2% Fibonacci retracement level in a discount for the bulls.
From a weekly perspective, the euro is in a corrective phase, so an upside correction is very possible.
Therefore, the current support in the DXY is fragile.
EUR/USD, weekly chart
