WTI Price Analysis: Eases from three-week-old resistance line, 21-DMA
- WTI steps back from two-week high as MACD teases bulls.
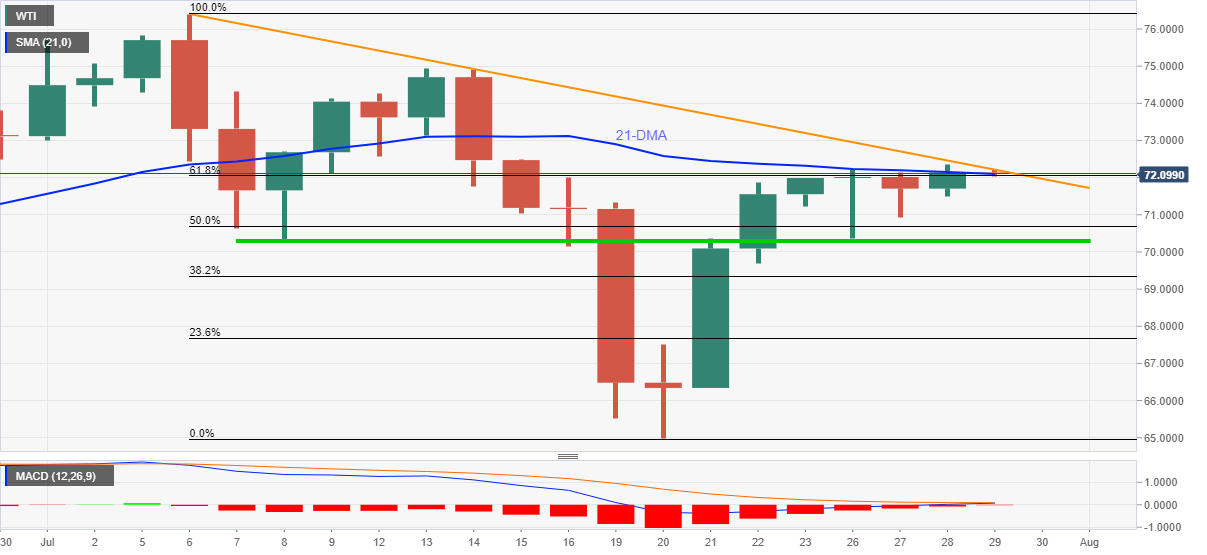
- 61.8% Fibonacci retracement of early-July drop adds to the upside filters.
- Short-term horizontal area challenges bear’s entry, bulls can eye $75.00 on successful run-up.
WTI oil prices seesaw around $72.00, down 0.15% intraday, during Thursday’s Asian session.
The energy benchmark refreshed two-week top the previous day while posting a daily close beyond 21-DMA and 61.8% Fibonacci retracement (Fibo.) for the first time since July 14. However, a confluence of the stated moving average and a downward sloping trend line from July 06, near $72.20, triggered the quote’s pullback afterward.
As MACD teases bulls for the first time in 18 days, backed by the US dollar weakness, WTI prices may overcome the immediate hurdle surrounding $72.20.
Following that, the mid-month top near $75.00 will lure the oil buyers ahead of the monthly peak of $76.40.
On the flip side, 50% Fibonacci retracement and a three-week-old horizontal area, respectively around $70.70 and $70.30, will precede the $70.00 psychological magnet to challenge the WTI sellers.
Should the black gold remains weak past $70.00, its gradual fall towards July 20 high near $67.50 can’t be ruled out.
WTI: Daily chart
Trend: Further upside expected