GBP/JPY Price Analysis: Monthly resistance probes bulls past-156.00 amid overbought RSI
- GBP/JPY seesaws around two-week top, portrays nine-day uptrend.
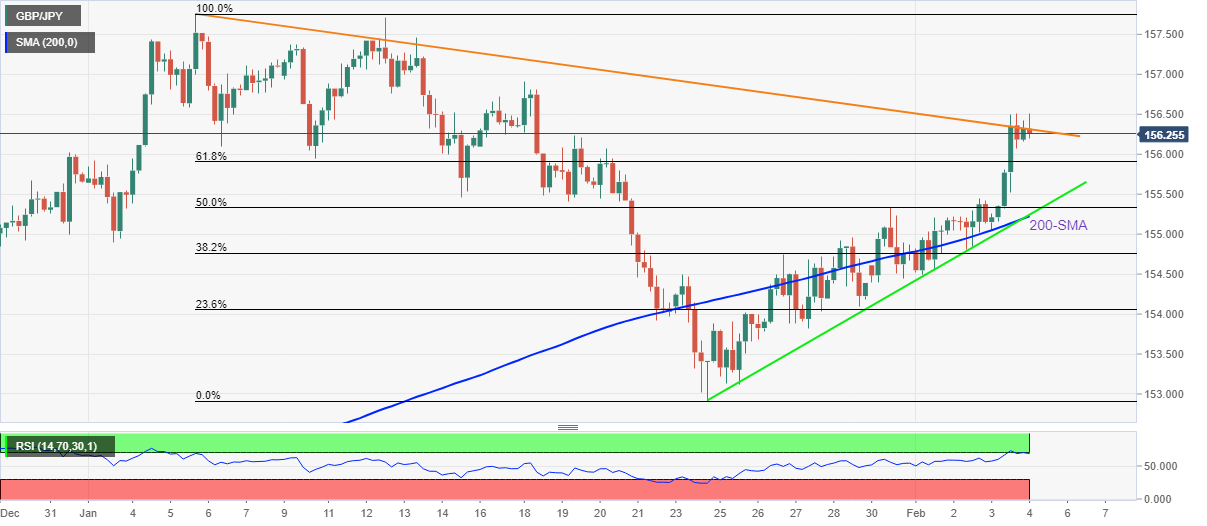
- Key resistance, overbought RSI conditions hint at pullback moves.
- 200-SMA, two-week-old support line offers a tough nut to crack for sellers.
GBP/JPY struggles to extend the previous eight-day uptrend, retreating from an intraday high to 156.30 during Friday’s Asian session.
In doing so, the cross-currency pair justifies the overbought RSI conditions as a downward sloping trend line from January 05 challenges the bulls around 156.30.35.
It should be noted, however, that a pullback will initially aim for the 61.8% Fibonacci retracement level of January’s downturn, around 155.90.
However, a convergence of the 200-DMA and a three-week-long rising trend line, near 155.20, will challenge the GBP/JPY bears afterward.
On the contrary, an upside clearance of the 156.35 hurdle will GBP/JPY prices towards January 18 swing high near 156.90 and then to the 157.00 threshold.
In a case where GBP/JPY buyers manage to keep reins past 157.00, multiple hurdles around 157.40-50 will be crucial for a watch.
GBP/JPY: Four-hour chart
Trend: Further weakness expected